| Contents |
| Software |
| Application Architecture |
| Convert BIN |
| Flight Data |
| Flight Ribbon |
| Open Flight |
| Save Flight |
| Splitter Bar |
| Views |
| Manoeuvre Animation |
| Settings |
| Graph Display |
| Technical |
| Errors |
Software
The Flight Coach software is available from this website and may be run on-line and offline. The latest version supports all mainstream operating systems (Windows, Linux, Android) using Chrome browser and on iOS devices using Safari browser.
https://www.flightcoach.org/ribbon/plotter.html
Flight Plotter is free software ( see below ¹ ): you can redistribute it and/or modify it under the terms of the GNU General Public License as published by the Free Software Foundation, either version 3 of the License, or (at your option) any later version.
Flight Plotter is distributed in the hope that it will be useful, but WITHOUT ANY WARRANTY; without even the implied warranty of MERCHANTABILITY or FITNESS FOR A PARTICULAR PURPOSE. See the GNU General Public License for more details.
You should have received a copy of the GNU General Public License along with Flight Plotter. If not, see <https://www.gnu.org/licenses/>
If you wish to further the Flight Coach software development or adopt the software for other purposes you are welcomed to do so as long as you fulfil this Licence (including exclusions) obligations. Please approach us if you have any questions at flightcoachoperations @ gmail.com.
(¹) Exclusions:
1. The sites.json file contains GPS coordinates of many flying sites and its use is restricted as below.
2. Any commercial use of the Software or the Data is restricted as below and requires written approval from the FlightCoach.org.
You may not, without Flight Coach prior written consent, conduct, cause or permit the:
(i) use, copying, modification, rental, lease, sublease, sublicense, or transfer of the Licensed Software and Data;
(ii) creation of any derivative works based on the Licensed Software and Data;
(iii) reverse engineering, disassembly, or decompiling of the Licensed Software and Data;
(iv) use of the Licensed Software and Data in connection with service bureau, facility management, timeshare, service provider or like activity whereby You operate or use the Licensed Software for the benefit of a third party;
(v) use of the Licensed Software and Data by any party other than You;
(vi) use of a later version of the Licensed Software and Data other than the version that accompanies this License Agreement unless You have separately acquired the right to use such later version through a License Instrument or Support Certificate;
nor (vii) use of the Licensed Software and Data above the quantity and Use Level that have been licensed to You under this License Agreement or the applicable License Instrument.
Application architecture
The Flight Coach application purpose is to present the flight logged in Ardupilot BIN format as a 3D ribbon. The ribbon reflects the recorded model attitude (roll, pitch, yaw) and the position (distance and altitude from the Point of Origin translated to the pilot position). Once the BIN file has been converted to a 3D flight path and split into individual maneuvers, the converted flight and its metadata (field info) may be stored in a JSON format. This allows storing and sharing pre-analysed flights.
It has been implemented in javascript and is using technologies that create a local copy of the plotter application software within the browser storage. This copy remains available for full use as an offline application. Upon reconnecting to the Internet, the latest version of the application will be automatically loaded (if available, please apply Ctrl-Shift-R to refresh the app cache). No need install anything manually or check for updates and versions :).
Components:
– BIN file format has been defined by the Ardupilot.org
– Google Chrome or iOS Safari browsers. Using other browsers is at your own risk
– application is using open source 3D Three.js javascript library
– other open source libraries: bootstrap, chartist, element, jquery, vue and others
Convert BIN
Once the flight is complete, transfer the flight log from the Ardupilot SD card into the Flight Coach application.
The method of copying the flight data to your device depends on your hardware but most commonly it will involve copying the flight logs from a micro SD card. In some cases, transfer may be achieved using a radio link, thus there would be no need to remove the SD card from Ardupilot. This method is more advanced and out of scope for this manual.
Practical note – number of flights can be recorded over 1 or more sessions and the analysis performed upon returning from the field. A pilot may keep manual notes related to the flights for further analysis assistance.
Practical note – it has been most convenient to have the Ardupilot installed in a model in a way that facilitates easy removal. It is much easier to remove the SD card when Ardupilot HW is handled outside the model.
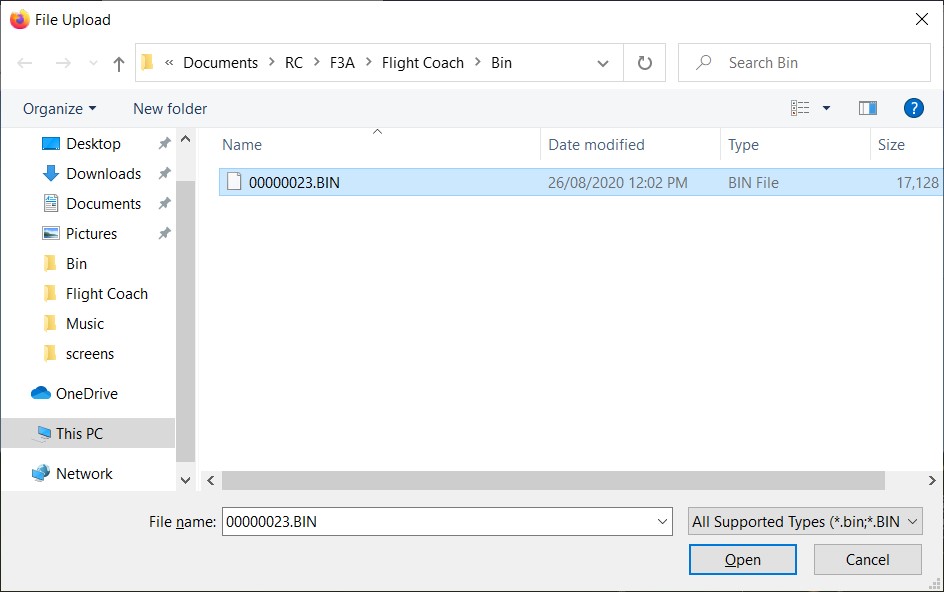
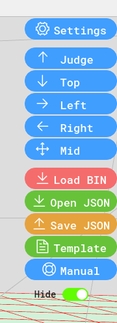
On the Flight Coach screen, use the red Load BIN button to browse files on your PC and select the appropriate file.
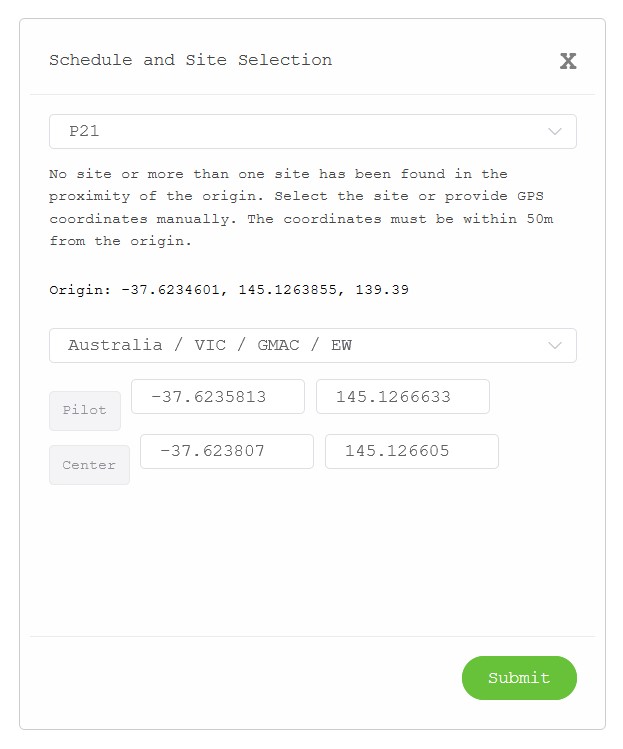
You will then be prompted to select the schedule, and location. Eg:
It is the user responsibility to select the right schedule out of the provided classes and schedules. Each schedules may have different minimum altitude cutoff. For ground test use Ground Test, Test schedule. For General flying, please use the Generic, Generic option.
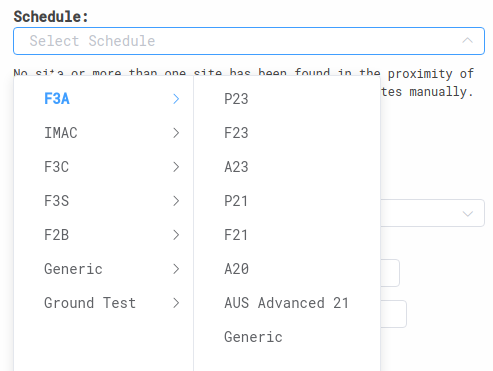
The schedule is used to split the flight into manoeuvres, which may be later edited via the Splitter Bar. If the wrong schedule is selected at this point, it will be necessary to start the Convert BIN process again.
Use Site Selection to select the location and orientation of the flight. Flight Coach will attempt to automatically determine the location. If your location is not known, you will need to manually enter location details as GPS co-ordinates.
The application has built-in a flying site database, which can be extended to include all fields where the Flight Coach has been used. At this stage you need to send us the details of the site (country, district, location, site, pilot GPS, centre GPS) and we will include it in the dB. The Site dB removes the need to manually enter the site each time as the site can be automatically located and selected in the 50m vicinity of the Origin.
Manual Site Selection
First, determine the GPS location of the pilot position (eg: where the pilot stands), and the center point of the box. The tracking hardware may be used to generate a BIN file, which can be used to determine the required GPS co-ordinates. To record the position: Turn the hardware on, wait until it starts recording, then switch off.
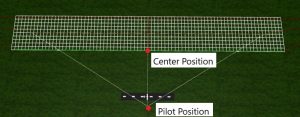
Then walk towards the center point, which can be anywhere along the center line in front of the pilot, but closer to 150m will provide better accuracy. Again, switch the tracking hardware on, wait for it to start recording, then switch off. This will create a 2nd BIN file.
Select the site as “manual”.
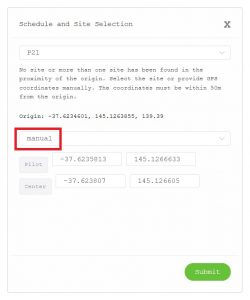
Load the BIN file you used to record the pilot position and note the GPS co-ordinates, as shown as the Origin. These will be entered as the Pilot position.
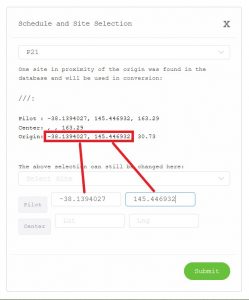
Load the BIN file you used to record the center position and note the GPS co-ordinates, as shown as the Origin. These will be entered as the Center position.
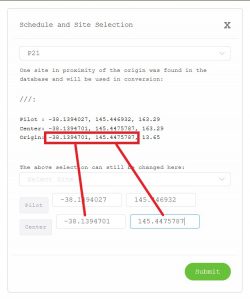
Once entered, Flight Coach will remember the manual location you entered, so you won’t need to re-enter these details until you change locations.
Flight Data
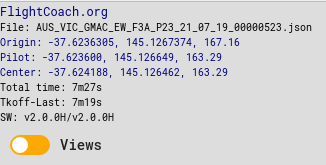
Flight Data is available in the top left corner. From the top:
- Link to the Flight Coach web site
- name of the currently loaded file
- Origin data displayed as a link to the Google Maps
- Pilot data displayed as a link to the Google Maps
- Center point data displayed as a link to the Google Maps
- Estimated Total flight time. Flight Coach displays the data above certain altitude only (10m for F3A). The time is calculated as the time stamps from the last data point minus first data point plus 1.5% for takeoff and landing tails (total +3%)
- Estimated flight time from the takeoff to the last maneuver end. Flight Coach displays the data above certain altitude only (10m for F3A). The time is calculated as the time stamps from the last data point in the last maneuver minus first takeoff data point plus 1.5% for takeoff
- Current and available software versions. If they differ, please restart the browser. If the difference persists, please do full reload (Ctrl-Shift-R in Chrome) or reset the browser cache
Flight Ribbon
Flight ribbon is colored to assist in visual model attitude assessment. Yellow color signifies the upright model position while the magenta color inverted. Transition to the knife edge position will see the ribbon color stepping each 15 deg.

Open JSON
Used to open previously saved flights. Browse files on your PC and select the appropriate file.

Save JSON
The flight may be saved as a .json file, which will include metadata about the flight such as splitting the flight into manoeuvers.

The filename will be automatically generated using the location, schedule, date and the original BIN filename.
Splitter Bar
The Splitter Bar is used to separate the flight into individual manoeuvres so that they can be individually observed and analysed.
A brief text description of each manoeuvre is shown below the line, and manoeuvres may be selected with the mouse on the text area.
The Splitter Bar may be hidden or displayed by the 3rd switch button from the left. You may choose to display a single manoeuvre or multiple manoeuvres via the 4th switch button from the left.
The data collected by the hardware, and used by Flight Coach, consists of a series of data “points” measuring the position of the model. The Splitter Bar automatically separates the flight into separate manoeuvres by estimating the percentage of the entire flight that each manoeuvre will consume. Eg:
| Manoeuvre | Screen Text | Percentage |
| Takeoff | tkoff | 3 |
| Vertical 8 | v8 | 10 |
| Stall Turn | stall | 5.1 |
| … etc | ||
| Avalanche | aV | 6.6 |
| Landing | Lnd | 3 |
These preset positions of the end of each maneuver may be amended by selecting the manoeuvre, and then using the green -/+ buttons. The blue arrow buttons allow select previous and next maneuvers (for display and adjustments). Adjusting each maneuver end point automatically adjust the subsequent maneuver start point.
The Splitter bar displays the fly duration of each maneuver in seconds.
The orange arrow buttons allow positioning the model at the << beginning of the maneuver, >> the end or moving the model one data point at a time. The Red button toggles the model flying the maneuver.
Views
Flight Coach provides 5 different views that you can use to observe and assess the flight.
The most useful will be:
- Judge View (eg: the position judges sit at)
- Mid height (eg: a position in the air at the middle of the box)
Also provided are:
- Top View
- Left Side
- Right Side
Additionally, the view position can be manually changed using the mouse. The orbit controls using mouse are:
- Left button down – Rotate the view
- Right button down (or Shift + Left button down) – View panning (left/right, up/down)
- Roller wheel – Zoom in and out
Manoeuvre Animation
The orange arrow buttons allow positioning the model at the << beginning of the maneuver, >> the end or moving the model one data point at a time. The Red button toggles the model flying the maneuver.

Settings
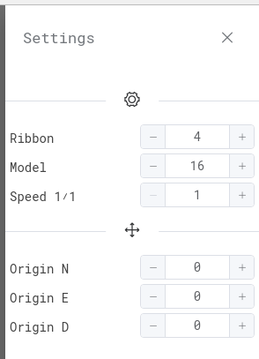
- Ribbon – Set the size of the flight ribbon displayed
- Model – Set the size of the model displayed
- Speed 1/x – Speed 1/x allows slowing down the model animation speed. On some devices the speed of the model is too fast. The model is advanced and redrawn 60 time/s. Speed setting allows waiting the specified number of frames before the model is advanced. For example, if it it set to 10, the model will move only each 10th frame
- Origin adjustments (Advanced). If you believe that the captured Origin was off, you can manually move it using NED controls. The adjustments are done in Ardupilot NED coordinates so it will not be fully aligned with the XYZ on the screen but if you observe the Origin cone you can tune it to the desired position. If you want it in the Pilot position just set the NE values to anything and reset them back to 0. If you want to go back to the log Origin, you need to reload the flight
Graph Display
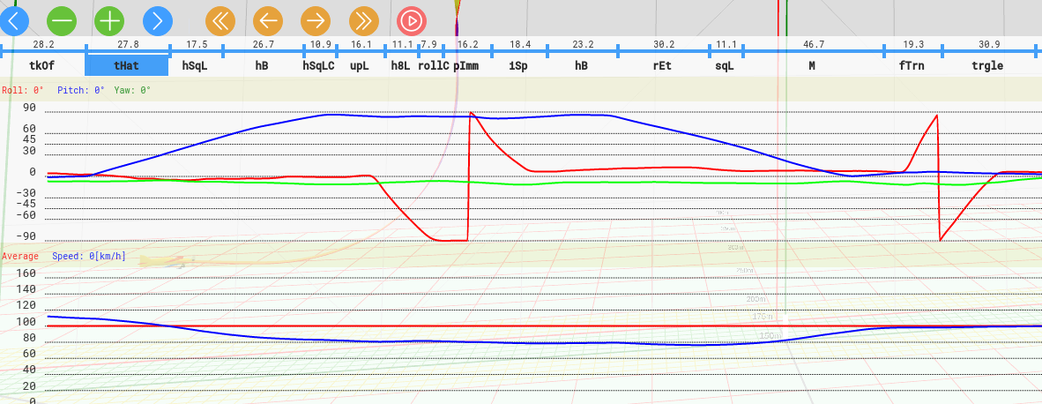
The top Attitude Graph display can be opened/closed flicking the Att switch Button. The graph shows the model attitude over time. When model position buttons or animation are used, the model attitude at the position is marked with a vertical line on the graph and numerical values are displayed (in degrees). The displayed attitude is relative to the ground, i.e. the wind component is included.
- Roll (eg: ailerons) as displayed by the red line
- Pitch (eg: elevator) as displayed by the blue line
- Yaw (eg: rudder) as displayed by the black line
The bottom Velocity Graph display can be opened/closed flicking the Vel switch Button. The graph shows the model velocity over time. When model position buttons or animation are used, the model velocity at the position is marked with a vertical line on the graph and numerical values are displayed (in km/h). The displayed speed is relative to the ground, i.e. the wind component is included in the velocity.
- model average speed over recorded flight is displayed by the red line
- model current speed is displayed by the blue line
Attitude Views
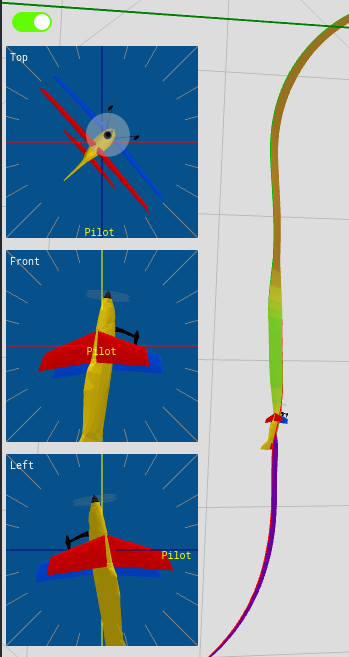
The Attitude Views display can be opened/closed flicking the Views switch Button. The three small windows display the model attitude at a current position. When model position buttons or animation are used, the model attitude at the position will change in each view. The radial lines have 15 deg intervals.
Note – to see the absolute and precise roll/pitch/yaw values please refer to the Attitude graph
- Top View has the camera positioned directly above the model and looks down
- Left View has the camera positioned at the model altitude and looks at the model towards right of the screen
- Front View has the camera positioned at the model altitude and looks at the model towards from the front towards the back of the screen
Technical
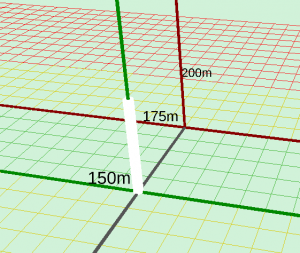
Dimensions of the F3A box and field displayed are:
- Pilot position to start of box, and start of green grid: 150m
- Pilot position to end of box, and middle of green and yellow grid: 200m
- The box is 120º wide (eg: 60º from center line), and 60º high
- Judge View position is 7m behind the pilot
Errors
Nothing recorded on SD card
Check firmware parameters have been correctly written
Check SD card is formatted.
- Insert SD in a PC
- Format
- Check that files can be written to the SD card
Nothing displayed after loading BIN
Check site details and GPS co-ordinates. Origin may be missing.
It is necessary to have the Origin as accurate as possible. Origin is captured when the GPS has locked in and several other conditions are met, like model velocities are very small, etc.
The model should be stationary and less than 50m from your pilot position, and (roughly) level, and then controller should be turned on. It will go through the initialisation sequence including arming itself, and will wait for the GPS to lock in.
First time on the day it may take longer, otherwise it should be 2-5 seconds.
On some hardware, the blue LED goes green and another blue LED on the GPS starts blinking. This means that the Origin has been defined, and it’s time to go flying. Check what lights apply to your hardware.
Otherwise, the Origin may not be set at all or set as some remote position.
If you want to recover a log captured with Origin incorrectly set, you can try selecting a manual site and pressing the Copy Origin button. It should show the ribbon although the center line direction will be skewed. If Origin in the dialog shows 0,0,0, there will be no way to recover the log.
Note: All displayed GPS positions (Origin, Pilot, Center) are links that will take you to Google Maps, just click them.
Erratic data and/or impossible results
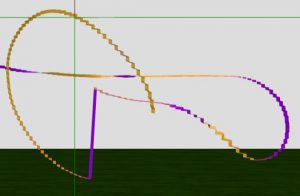
Position recording is inaccurate. Possible reasons may be:
Hardware malfunctioning – Check hardware. You can also read BIN file details into Mission Planner and then Google Maps to see further details of what is being recorded.
Hardware not initialized – Check initialization procedures
Hardware being interfered by SBEC or other devices – Move SBEC or other devices
Debugging BIN files:
a) When you open the plotter, use Ctrl-Shift-R to fully reload the plotter from the website, and then open Inspect window Ctrl-Shift-I and see what messages (if any) are shown in the Console tab. You can ignore the font errors. Then try to load a BIN file and check the console again.
b) Download and Open the demo JSON flight from the website. If you can see the demo flight and there are no errors, the problem will be in your BIN file.
c) Load your BIN file into Mission Planner and see if you can extract any kind of data
d) Confirm that you have used the correct firmware in your controller with our copy (from website) of parameters written to the controller. Plotter looks for specific parameters and some may not be enabled in the default setup. They are XKF1, XKF2, ORGN. See if you can see them in the log in Mission Planner.
e) Lastly, BIN files may vary slightly between hardware vendors
Copyright (c) 2020-21. All rights reserved.

